Conjoint Overview
Our customers are constantly making choices, some conscious, but most unconscious. Regular surveys questions with traditional question scales are unable to get to the core of why a consumer makes his or her decision. Most of these scales don’t simulate real-life conditions, which always include some type of real trade-offs.
To simulate real life consumer decision making, the most precise approach is through Conjoint Analysis.
Conjoint analysis is commonly used for:
- Designing and pricing products
- Healthcare and medical decisions
- Branding, package design, and product claims
- Environmental impact studies
- Needs-based market segmentation
The Choice-based conjoint analysis (CBC) (also known as discrete-choice conjoint analysis) is the most common form of conjoint analysis. Choice-based conjoint requires the respondent to choose their most preferred concept. This choice is made repeatedly from sets of 3–5 full profile concepts. See an example choice task below:
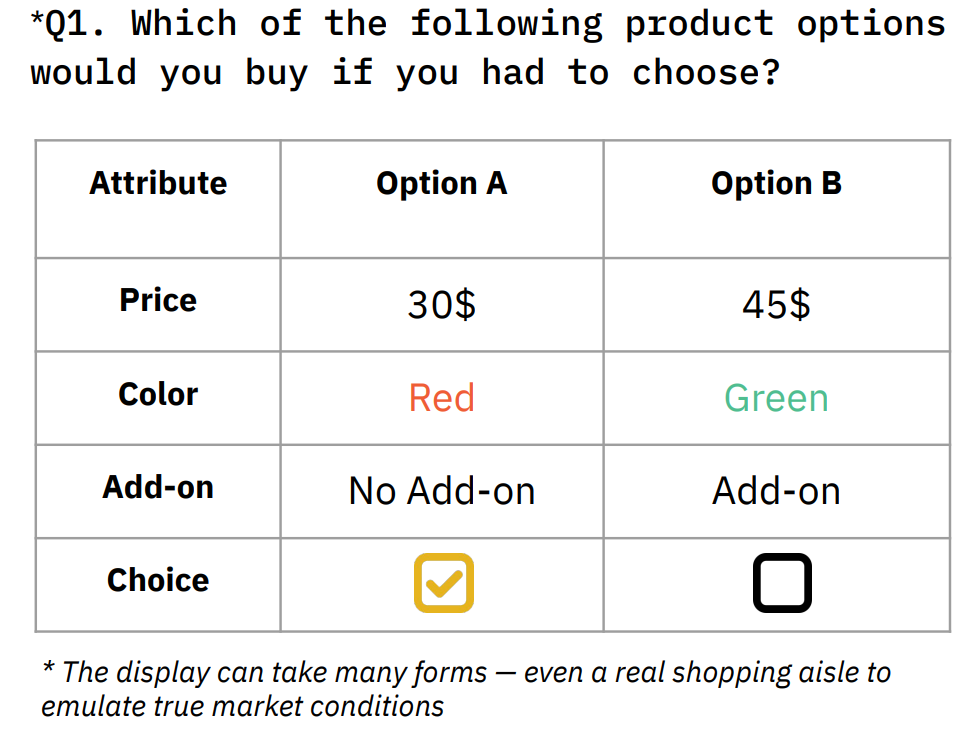
This choice activity is thought to simulate an actual buying situation, thereby mimicking actual shopping behavior. The importance and preference for the attribute features and levels can be mathematically deduced from the trade-offs made when selecting one (or none) of the available choices. Choice-based conjoint designs are contingent on the number of features and levels. Often, that number is large and an experimental design is implemented to avoid respondent fatigue.
The output of a Choice-based conjoint analysis provides excellent estimates of the importance of the features, especially in regards to pricing. Results can estimate the value of each level and the combinations that make up optimal products. Simulators report the preference and value of a selected package and the expected choice share (surrogate for market share).
Just as a golfer doesn’t use the same club for every shot, the researcher picks the right tool for each project’s specific requirements.
To get to a decision on what type of Conjoint to use, you’ve gotta ask yourself a few questions.
Firstly, the product or service needs to be broken down into component attributes and levels. Then, the decision of what is the best way to present options to customers or consumers (profiles) combined with the decision of which method should be used to find out which profiles are most preferred (eg choosing, ranking, rating). And finally the decision of which statistical estimation approach to determine the utility value of each attribute and level to the market (also known as part-worths).
These design decisions depend on the number of attributes to be considered, the contact method (online, face-to-face, phone or by post) and time available for the interview. In addition, the different flavours of conjoint analysis each have differing characteristics in analysis.
CBC is the most common form of conjoint analysis used professionally. Respondents are shown a set of potential products, and asked to choose the one they would select often with an option for None of these. Respondents complete a set of these ‘choice tasks’, most commonly 8-12 tasks in a set. This keeps the time required for the survey to a minimum.
Most commonly CBC is based on a full-profile design (each profile is made up from all the available attributes) and the number of products shown can range from 2 to “many” for instance in shelf-based displays used to test pricing for FMCG/CPG type products where there may be 30 brands to choose from at the same time in a ‘virtual’ shopping environment.
The limitation on the amount a respondent can absorb at a time, combined with the rapidly increasing number of “full-profile” combinations that come with large designs mean mean that choice-based conjoint is typically limited to 5-7 attributes, in contrast to 25-30 for adaptive and partial profile type conjoint anlaysis.
The main advantages choice-based conjoint gives you are greater robustness of results - particularly for pricing work, combined with shorter and therefore less costly fieldwork. It is also favoured for it’s rigour academically. It also enables comparisons with fixed products or fixed tasks enabling you to test new formulations against an existing gold standard or, in the more specialist form of Discrete Choice Modelling (alternate-specific designs), the end model can be tuned to real world data greatly increasing it’s predictive power.
ACBC is a method pioneered by Sawtooth Software, as an approach to tackle larger conjoint designs, but is still based on choice-design principles and are robust for tasks such as pricing. The design follows a series of stages starting with a Build-your-own section, then a screening section to identify an initial set of attributes and levels that a respondent will use in their decision making. These are then taken into choice tasks similar to CBC for ultimate estimation and selection.
The result is more complex, and slightly more time-consuming than a straight CBC study, but one that allows for more complex attribute sets to be used and that feels less repetitive and more intelligent to respondents as it learns from each stage.
Menu-based Choice modeling is an innovative conjoint-based method specifically designed for markets where the purchase choice is based on a menu. Think of a fast-food restaurant where consumers can create their meal by combining single items – burger and a soft drink – or buy a pre-configured menu.
The interview process in MBC is different from traditional CBC, where research participants choose between fixed concepts. Instead, they build their ideal concept/combinations of items using a menu, perfectly mimicking the type of choice they would face in real life.
Attributes (Features): The product features being evaluated by the analysis. Examples of characteristics for Laptops: Brand, Size, Color, and Battery Life.
Levels: The specifications of each attribute. Examples of standards for Laptops include Brands: Samsung, Dell, Apple, and Asus.
Task: The number of times the respondent must make a choice. The example shows the first of the five functions as indicated by “Step 1 of 5.”
Concept or Profile: The hypothetical product or offering. This is a set of attributes with different levels that are displayed at each task count. There are usually at least two to choose from.
Relative importance: “attribute importance,” which depicts which of the various attributes of a product/service is more or less important when making a purchasing decision. Example of Laptop Relative Importance: Brand 35%, Price 30%, Size 15%, Battery Life 15%, and Color 5%.
Part-Worths/Utility values: Part-Worths, or utility values, is how much weight an attribute level carries with a respondent. The individual factors that lead to a product’s overall value to consumers are part-worths. Part Worth Utilities should always be interpreted as relative
Optimal Bundle: Discover the ultimate product with the highest utility value. At a glance, lets you compare all the possible combinations of product profiles ranked by utility value to build the product or service that the market wants.
Market share simulation: One of the most unique and fascinating aspects of conjoint analysis is the conjoint simulator. This gives you the ability to “predict” the consumer’s choice for new products and concepts that may not exist. Measure the gain or loss in market share based on changes to existing products in the given market.
Willingness To Pay: How much more will help a customer pay for a Samsung versus an LG television? Assigning price as an attribute and tying that to a brand attribute returns a model for a $ per utility distribution. This is leveraged to compute the actual dollar amount relative to any characteristic. When the analysis is done relative to the brand, you get to put a price on your brand.
Price elasticity and demand curve: Price elasticity relates to the aggregate demand for a product and the demand curve’s shape. We calculate it by plotting the demand (frequency count/total response) at different price levels.
An ideal conjoint question will have roughly 5 attributes (rows), 4 concepts per set (columns), and roughly 5 - 10 sets. This will help ensure respondents are not fatigued. A detailed breakdown is below:
- Attributes - Roughly 5 attributes with no more than 10 total levels per attribute. Having less levels per attribute, ensures various concepts can be shown more often.
- Profiles - Roughly 4 Profiles to show each set. Too many Profiles per set, and you risk respondents not making effective choices. The total amount Profiles available is calculated by multiple the number of levels in each attribute. In the example above we had four flavors, three sizes, and two prices. Total Profiles available would be equal to 4 * 3 * 2 = 24. Ideally this number should be no larger than 50. The more total concepts, the harder it becomes to draw meaningful conclusions.
- Total Tasks- showing no more than 15 total sets to respondents to avoid survey fatigue.
We recommend collecting at least 100 responses for each segment being researched. For example, if you wanted to research both males and females, you would want to collect 100 responses for both.
Mathematicians Duncan Luce and John Tukey published the first source on conjoint in 1964, called ‘Simultaneous conjoint measurement: A new type of fundamental measurement’.
However, it is generally agreed that Paul E. Green and Vithala R. Rao’s 1971 paper, ‘Conjoint Measurement for Quantifying Judgmental Data’ is “the first detailed, consumer-orientated” approach to the topic. See History of conjoint analysis.
Conjoint analysis is a form of quantitative research. Respondents are asked to complete surveys with a number of product concepts which are presented in choice sets.
Market research helps pre-test products before launch as it is costly to release products into market without testing because of high risk of failure. Whereas non-conjoint research methods are not well-suited for taking into account key market factors (demand and competition),conjoint surveys are use a more realistic methodology which is closer to an actual buying situation.
Choice-based analysis (AKA discrete choice experimentation) is a type of response used in conjoint studies where respondents are tasked with choosing which option they would buy. It is considered the most reliable method of choosing responses as it is the most realistic in a market research context.
Unlike standard conjoint, in adaptive conjoint studies questions are not pre-determined and instead the survey ‘adapts’ to respondents’ choices to create each question. It is suitable for studies where there are a large number of attributes that otherwise would not fit functionally in a standard conjoint exercise.
Discrete choice analysis is examination of datasets that contain choices made by people from among several alternatives. Commonly, we want to understand what drove people to make these choices. For example, how does weather affect people’s choice of eating out, ordering food delivery, or cooking at home. Choice-based conjoint is another example of discrete choice analysis.
Conjoint analysis is a survey-based technique of presenting respondents with several options (each described in terms of feature and price levels) and measuring their response to these options. When the measured response is their choice between these options (rather than ranking or rating each of these options), it is called choice-based conjoint (which is the most commonly-used type of discrete choice experiments).
- Recognise the business problem.
- Create research questions.
- Choose survey methodology.
- Collect data.
- Clean data.
- Analyse data.
- Prepare presentation.
- Determine business action.
A partworth (AKA partworth utility or preference score) is a numerical score that measures how much each product feature influences the respondent’s selection of a particular concept.
Partworth utilities (AKA preference scores) are useful in describing average preferences for your customers (or sub-groups). For example, you can find that your customers in general prefer a particular colour, flavour or price (vs. another colour/flavour/price). Partworth utilities are the key output of Generic Conjoint because they help with feature selection. Conjoint preference share simulations are useful in showing that percentage of people will choose a particular colour/flavour/price given the choice of other products with different colour/flavour/price. Simulations are the key output of Brand-Specific Conjoint and Brand-Price Trade-Off because they help in predicting adoption, revenue, price elasticity, and cannibalisation.
Yes, if you use modern techniques of analysis, such as Hierarchical Bayes, you get individual-level preference scores (model coefficients). These scores can be used in clustering responses and investigating segments of buyers.