Best Practices
Regardless of what deck (or any deck at all) you use for inspiration, below are a few guiding principles that researchers should keep in mind when designing client deliverables.
-
Don’t bury the lede. In other words, begin with key information.
-
For example, key findings or takeaways should be in the first 2 to 3 slides
- All slide headlines, when concatenated, should add up to an executive summary
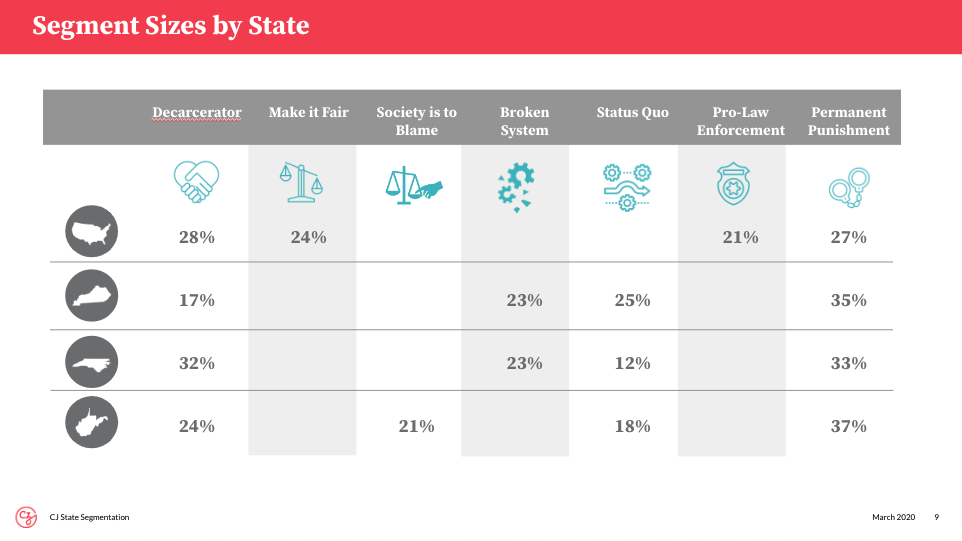
- Rather than repeating lengthy pieces of text to describe sub-groups or segments (e.g., “Southern Millennials who voted for Biden”), use representative shorthand icons
- For example, notice the use of icons to summarize segments and geographies—once introduced, these icons can be used repeatedly throughout the deck
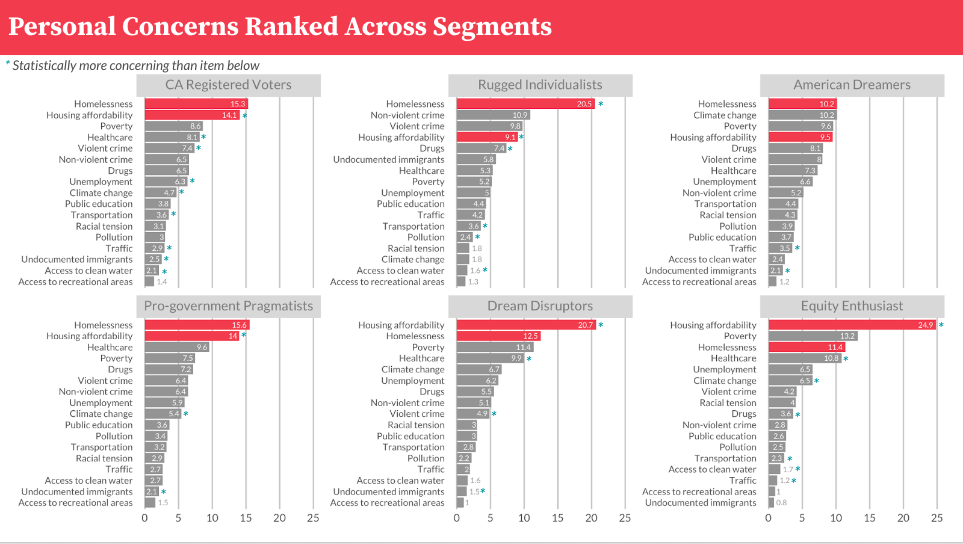
- Colors are a great way to effortlessly attract your audience’s eyes to key information
- For example, see how colors are used to quickly distill a large amount of information; the main takeaway being that housing affordability issues are important to all mindset segments in California
-
When you use a color or icon to represent a group, continue to use that color or icon throughout the deck; deviations increase the likelihood of confusing your audience
-
When you depict significance testing in a particular way, continue to repeat the pattern throughout the deck
-
Generally speaking, when you’ve established a pattern or heuristic for your audience, don’t deviate from it
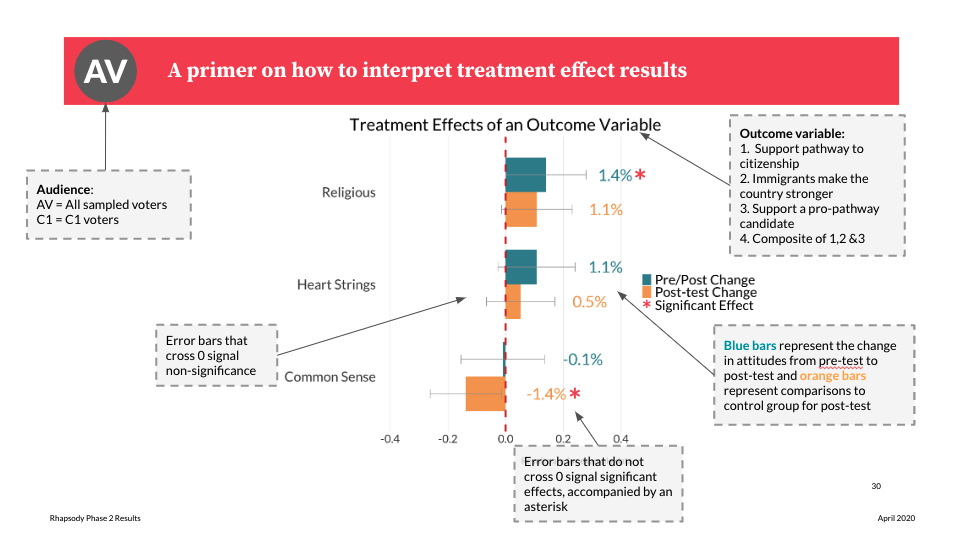
- Rather than depicting a complex table or plot, consider walking your audience through an annotated example to help them understand where to look for key information
- For example, this primer—with annotations, icons, and colors—was used to help the audience interpret results from a complex difference in differences experiment
-
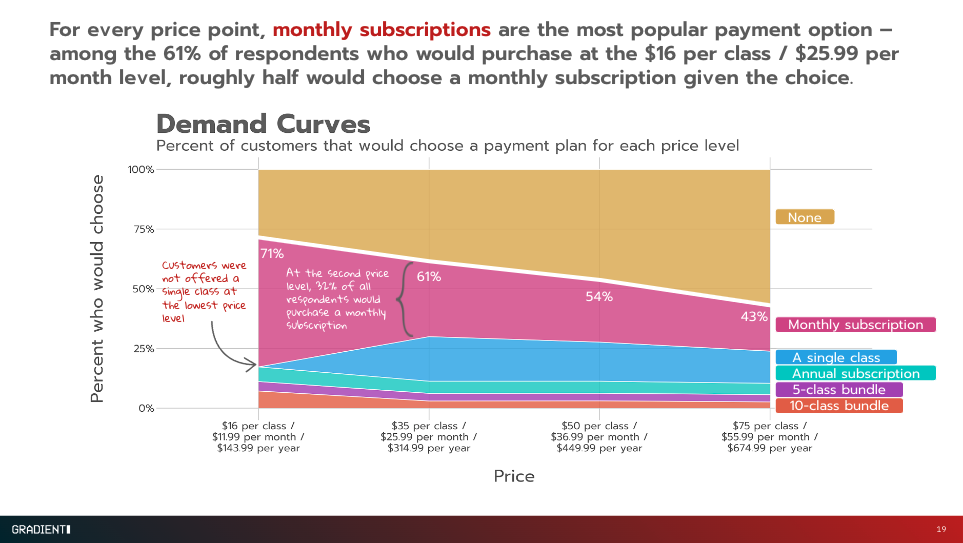
Even when it doesn’t warrant headline news, you may want to direct your audience’s attention to interesting findings
-
Additionally, annotations can be used to help audience members understand how to interpret findings
-
For example, notice how secondary how the following slide uses annotations to both call out a secondary finding and explain a potentially confusing methodological wrinkle
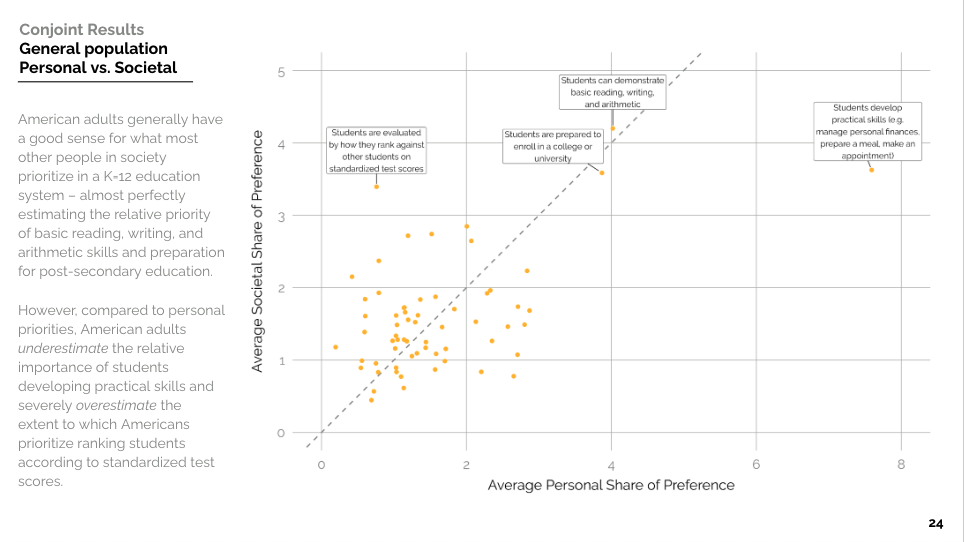
- When there are large magnitude differences, plots often do a better job of representing that than tables
- For example, the following plot visually depicts the relative importance of one attribute—a table would not convey the same magnitude difference quite so well
-
Stick to the same font and font sizes as much as possible
-
Make sure that elements of your slide are on the same spot as other slides
-
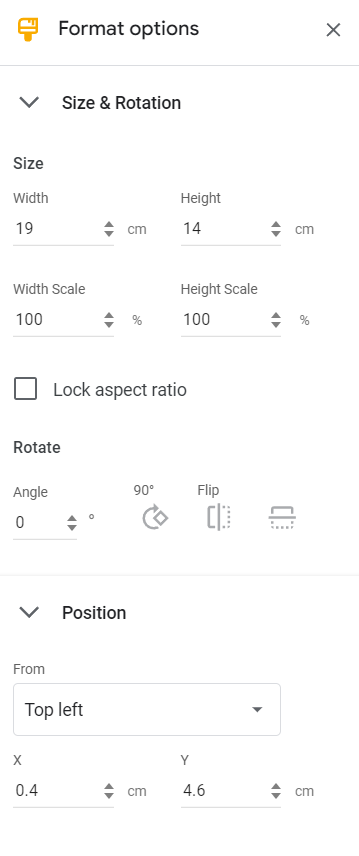
Make use of the Format Options panel to make elements the same size and keep the position in place